How To Install & Use Grafana On Raspberry Pi
Grafana is an interesting software solution that allows you to create dashboards and graphs to monitor anything from any database. Before Grafana, you needed to be or have a developer to turn data into something visual enough to analyze it. You can now do this easily with Grafana, and the great news is that it can be installed on a Raspberry Pi. Let’s see how it works.
Grafana is an open-source software that can be installed on a Raspberry Pi by downloading the corresponding pack from the official website. Other options are available, like a Docker container or adding a repository for the package manager (apt on Debian).
I will show you the latest option, as it’s the best way to keep everything up-to-date. The installation is not complicated, but there are a few commands to know. Then, I’ll give you a brief introduction to get started with your first data sources and dashboards on Grafana.
If you’re looking to quickly progress on Raspberry Pi, you can check out my e-book here. It’s a 30-day challenge where you learn one new thing every day until you become a Raspberry Pi expert. The first third of the book teaches you the basics, but the following chapters include projects you can try on your own.
It's a free PDF guide containing every Raspberry Pi Linux command you should know!
Download now
Install Grafana on Raspberry Pi
Here are the required steps to install Grafana on your Raspberry Pi:
- Install Raspberry Pi OS and complete the system updates.
- Add the Grafana repository to your system.
- Use APT to install Grafana from the added repository.
I will now explain each step in detail.
Step 1 – Install Raspberry Pi OS
There are many ways to install Grafana. The ARM architecture of Raspberry Pi is well-supported (armhf and arm64, by the way). You can download a Debian package and the source files, use Docker or add the Grafana repository.

Join Our Community!
Connect, learn, and grow with other Raspberry Pi enthusiasts. Support RaspberryTips and enjoy an ad-free reading experience. Get exclusive monthly video tutorials and many other benefits.
Learn moreWith all of these options, I tend to prefer the latter. By adding a new repository to your system, you’ll streamline the installation and update process. Each time you complete system upgrades, it will update Grafana to the latest version available, which is a good practice.
It's a free PDF guide containing every Raspberry Pi Linux command you should know!
Download now
So, I’m creating this tutorial by using Raspberry Pi OS Lite, 64-bit, and I recommend that you do the same.
If you need help to do this, you can read my Raspberry Pi OS installation guide there.
Once installed, make sure to browse this checklist:
- Network connected.
- System updates done.
- Optional: SSH enabled, and connection established from your computer.
Once done, you can move to the next step to add the Grafana repository on Raspberry Pi OS.
And if you prefer the other installation options, you can check their website for more details.
Step 2 – Add the Grafana repository to your system
You can add the Grafana repository to your system with only two commands:
- Open a terminal, or use the SSH connection from your computer.
- Download and install the repository key:
wget -q -O - https://packages.grafana.com/gpg.key | sudo apt-key add - - Add their server URL to the APT sources list:
echo "deb https://packages.grafana.com/oss/deb stable main" | sudo tee -a /etc/apt/sources.list.d/grafana.list
That’s it, APT can now use their server as a source for future installations and updates. We can move to the next step.
Note: Grafana has two versions: OSS and Enterprise. I’m showing you how to install and use the open-source edition only. Check their website for more details on the differences between them. There is also a Cloud version where you don’t need a local setup.
Step 3 – Install Grafana
Once the system ready and the repository is added, installing Grafana is straightforward.
Just open a terminal and type these commands:sudo apt update
sudo apt install grafana
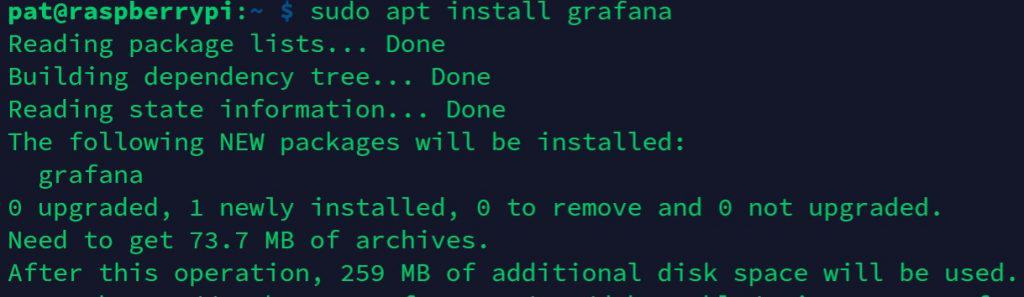
After a few seconds, Grafana will be installed on your system. Grafana works as a service, but it’s not started automatically. There is an extra step to start it, and configure it to start automatically on boot. The commands are given at the end of the installation:sudo /bin/systemctl daemon-reload
sudo /bin/systemctl enable grafana-server
sudo /bin/systemctl start grafana-server
You can use the “status” command to make sure the server has started properly:sudo /bin/systemctl start grafana-server
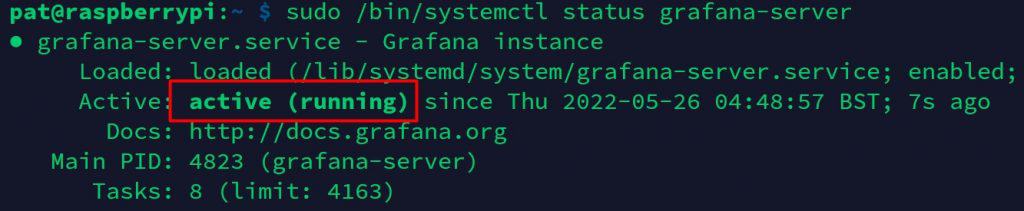
Looks good! Let’s now learn how to use it.
Are you a bit lost in the Linux command line? Check this article first for the most important commands to remember and a free downloadable cheat sheet so you can have the commands at your fingertips.
It's a free PDF guide containing every Raspberry Pi Linux command you should know!
Download now
If you are looking for exclusive tutorials, I post a new course each month, available for premium members only. Join the community to get access to all of them right now!
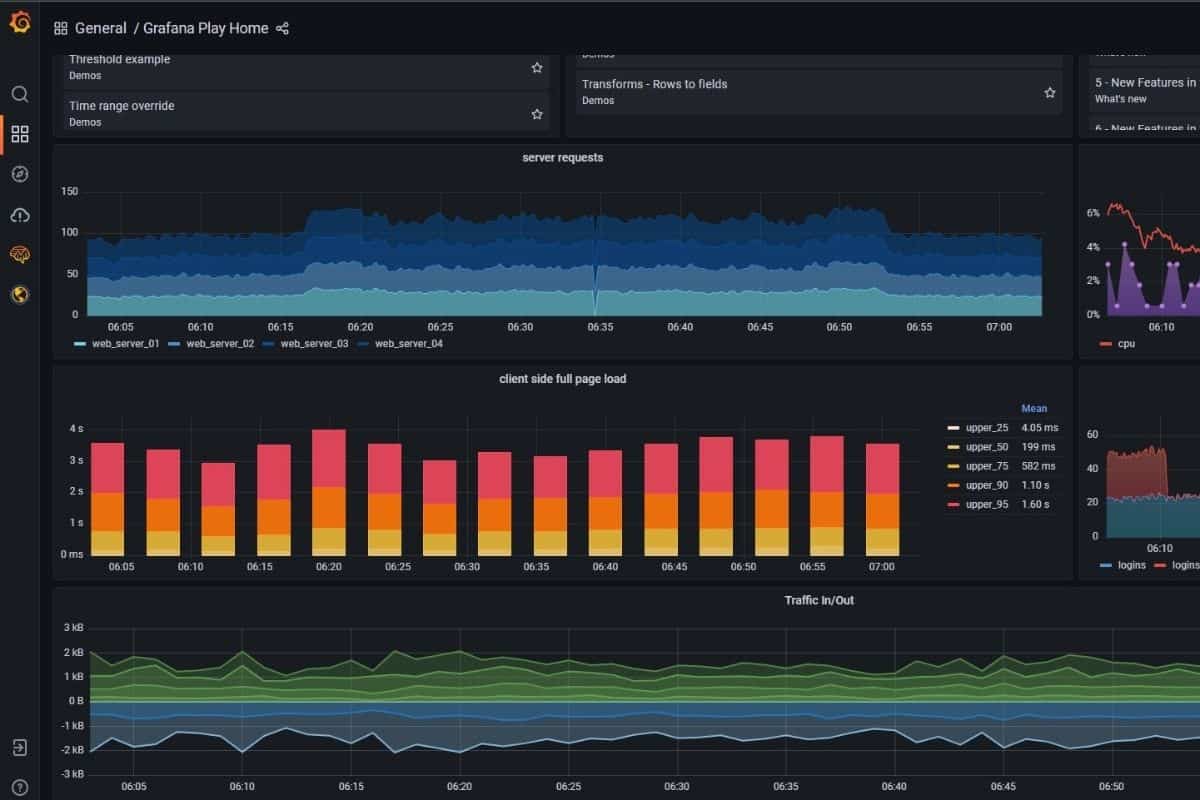
Getting Started With Grafana On Raspberry Pi
The Grafana service has a web interface to monitor and configure everything. Good news, you don’t need the terminal anymore ;-).
It's a free PDF guide containing every Raspberry Pi Linux command you should know!
Download now
First access
By default, Grafana runs on the port 3000, so you can access it from your web browse, on any computer on the same network:http://<RASPBERRYPI_IP>:3000
If you don’t know your Raspberry Pi IP address, I recommend reading this article first.
The first thing you’ll see is this login form:

Use the default credentials: admin / admin.
You’ll then be asked to change the default password, which is highly recommended.
Once done, you should get access to the full Grafana interface:
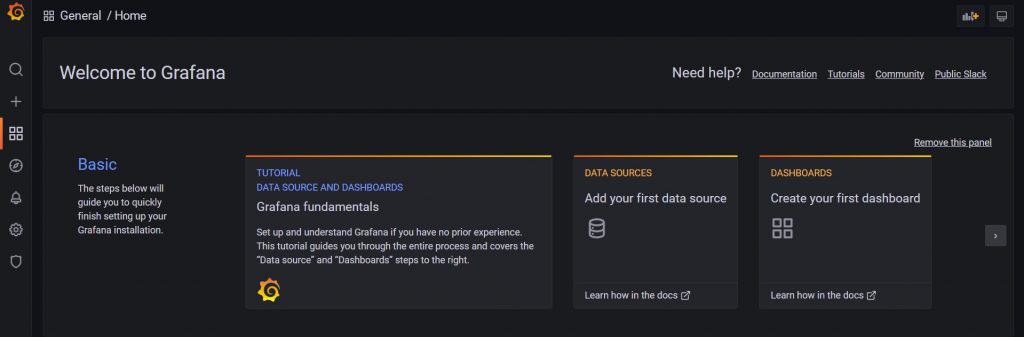
Getting started with Grafana might feel overwhelming. I will give you a few tips to get started in the next paragraphs, but I encourage you to check all the tips and documentation they have for you. As you can see on my screenshot, they show you the first steps, with a link to a tutorial, and asking to create data sources and dashboards.
Add a data source
Before creating any dashboard and graphic, you need to have some data source connected.
A data source can be anything. For example, let’s say you have a sensor logging the current temperature every minute. If the database where you store this information is compatible, you can easily connect it to Grafana to draw your temperature history on it.
Grafana works natively with a lot of databases:
- Time-series: Prometheus, Graphite, OpenTSDB, InfluxDB.
- Logging & document: Loki, Elasticsearch.
- Distributed: Jaeger, Zipkin, Tempo.
- SQL: MySQL, PostgreSQL, SQL Server.
Check my recommendations here for the best database server on Raspberry Pi. - Cloud: Google Cloud Monitoring, CloudWatch, AzureMonitor, Grafana Cloud.
- Enterprise solutions: Wavefront, Splunk, Snowflake, ServiceNow, SalesForce. New Relic, MongoDB, Jira, GitLab, etc.
And you can also find plugins for Grafana on their website, to use even more data sources.
Here is an example on how to install the JSON API plugin from Marcus Olsson:sudo grafana-cli plugins install marcusolsson-json-datasource
sudo /bin/systemctl restart grafana-server
Warning: not all plugins are compatible with the latest Grafana version.
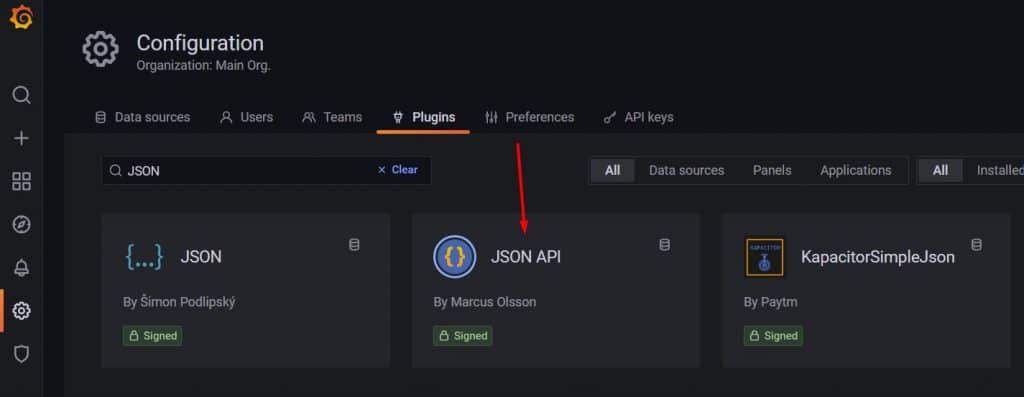
Once installed, you’ll find the new plugin in the Configuration > Plugins submenu in the Grafana interface:
It will also be added to the list of available sources types when you click on “Add new data source”:
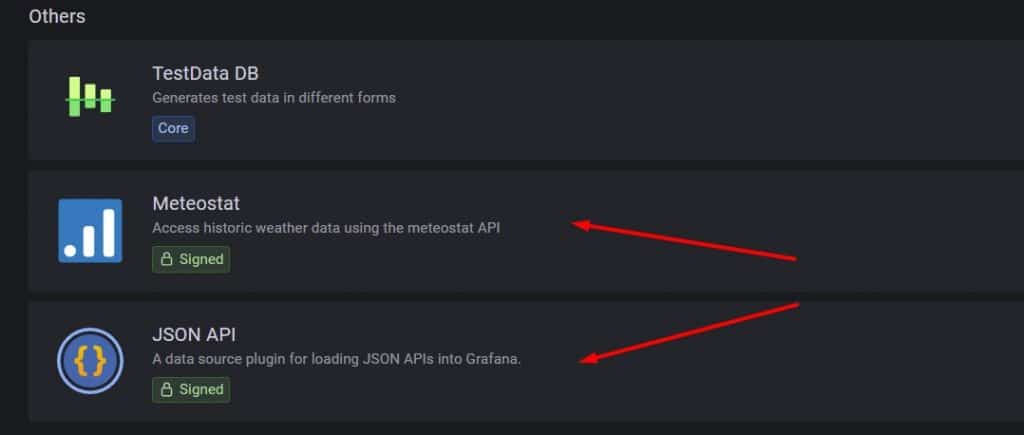
Meteostat and JSON API are two plugins I added through the same process.
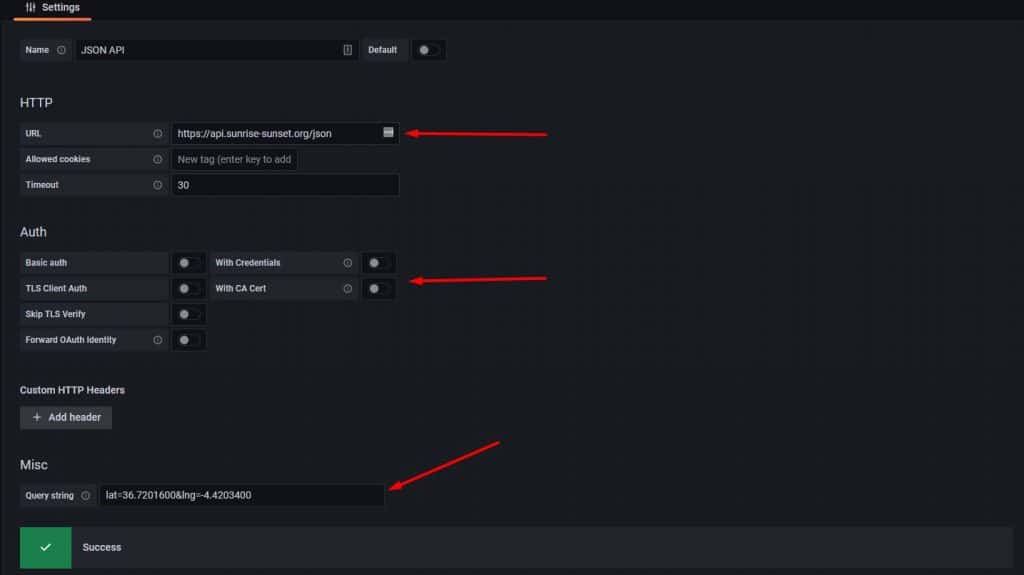
To create a source then, you’ll fill out the form corresponding to the source type you choose in this list. For example, a basic JSON API can work with simply the URL and the query string. I tested with the same API I use in my book about Python, where I synchronized my smart lights with the sunset and sunrise times:
Create your first dashboard
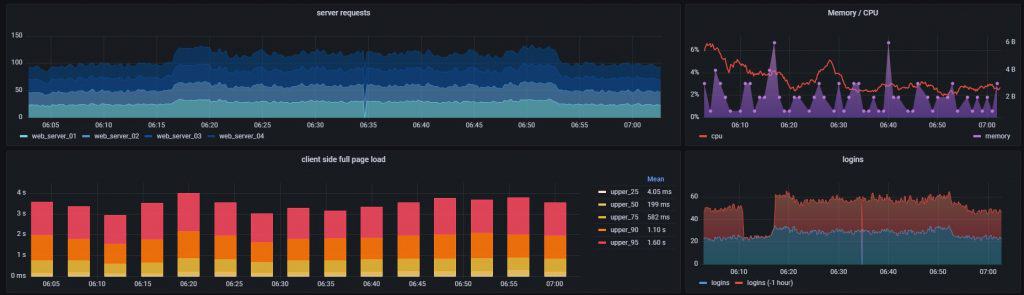
A dashboard is a page, with one or several graphs, that are connected to any of your data sources to display the data, making it easy to analyze for you. In Grafana, each dashboard can have several rows and panels to show anything you need for a specific purpose.
So, creating a dashboard will vary a lot depending on your goals, but let’s continue with my dumb example:
- On the home page, click on “Create your first dashboard”.
- Then, click on “Add new panel”.
- You then need to choose your data source and fill out the form to show exactly what you want in the corresponding panel.
This step will be entirely different for each data source.
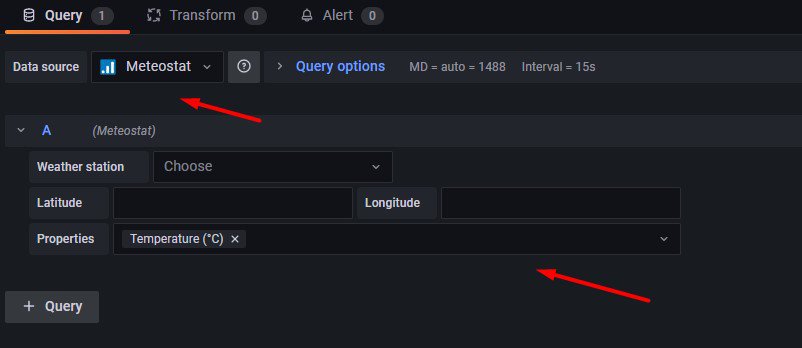
With Meteostat, you choose the Weather station and data you want to display.
And with JSON API, the query is already built in the data source, you only pick one value from the result: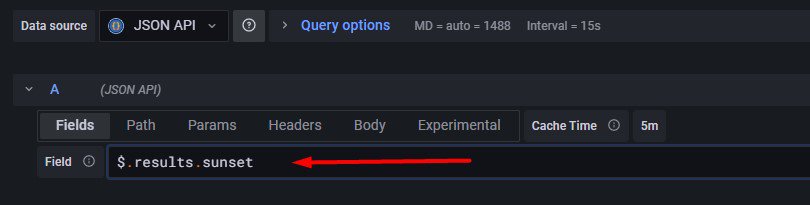
The field format is a bit weird, but there is an autocomplete, so you’ll quickly get it.
As your experience will vary a lot depending on the plugin or data source you use and the values you intend to display, I highly recommend checking the corresponding documentation at this point – I can’t cover everything in this article.
I have found that the plugin documentation is generally enough to understand how they work, and helps a lot to create your first graphs. Maybe I was just lucky with my plugin choices, but I had no issue creating the first graphs.
Obviously, Grafana goes way further, this was just an introduction. If you want to see the full potential, you can check their sandbox installation here. It’s the same interface, accessible for free, with tons of data sources already connected, so you can play with it.
And please let me know in the community if you build interesting projects with it or have additional questions!
Whenever you’re ready, here are other ways I can help you:
The RaspberryTips Community: If you want to hang out with me and other Raspberry Pi fans, you can join the community. I share exclusive tutorials and behind-the-scenes content there. Premium members can also visit the website without ads.
Master your Raspberry Pi in 30 days: If you are looking for the best tips to become an expert on Raspberry Pi, this book is for you. Learn useful Linux skills and practice multiple projects with step-by-step guides.
The Raspberry Pi Bootcamp: Understand everything about the Raspberry Pi, stop searching for help all the time, and finally enjoy completing your projects.
Master Python on Raspberry Pi: Create, understand, and improve any Python script for your Raspberry Pi. Learn the essentials step-by-step without losing time understanding useless concepts.
You can also find all my recommendations for tools and hardware on this page.