How To Install & Use Wireshark On Raspberry Pi
Wireshark is a free and open-source tool to capture and analyze network traffic. Basically, it will intercept network packets and display their content in a nice interface, so you can analyze them. It’s available on Raspberry Pi. I will show you how to install it on your device, and share interesting features for you to use.
Wireshark can be installed on Raspberry Pi from the default repository. It’s available in the Add/Remove software tool, or via the command line, by using APT: “sudo apt install wireshark”.
But once installed, the first steps might be a bit confusing if you never used it before. So keep reading for the full installation procedure, and an introduction to some of the most powerful features.
If you’re looking to quickly progress on Raspberry Pi, you can check out my e-book here. It’s a 30-day challenge where you learn one new thing every day until you become a Raspberry Pi expert. The first third of the book teaches you the basics, but the following chapters include projects you can try on your own.
How To Install Wireshark on Raspberry Pi
Here are the required steps to install Wireshark on Raspberry Pi OS with Desktop:
- Open the main menu.
- Go to Preferences > Add / Remove Software.
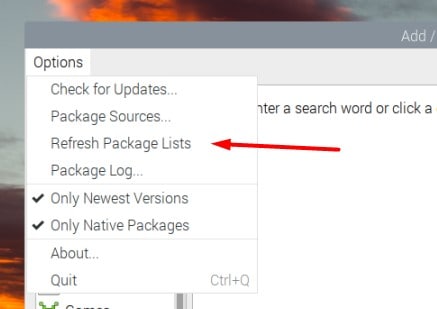
- Open the “Options” menu, and click on “Refresh package lists”.
- Then, type “wireshark” in the search engine and press Enter.
- Find the main package for Wireshark in the results, and check the corresponding box:
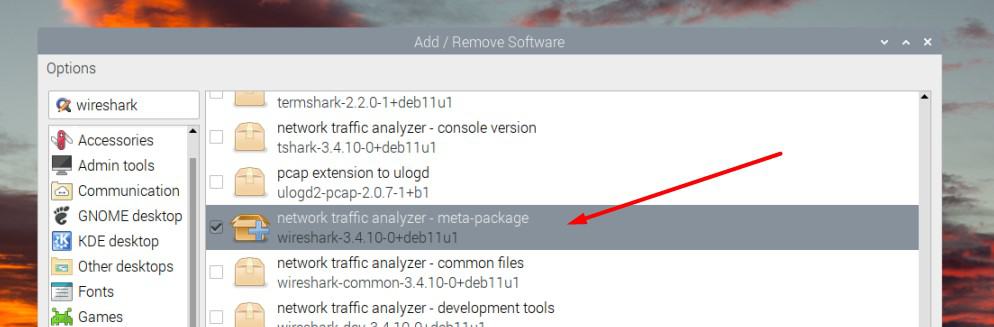
- Click on “Apply” and enter your password to install it on your system.
A few seconds later, Wireshark will be available in the main menu, under the “Internet” category.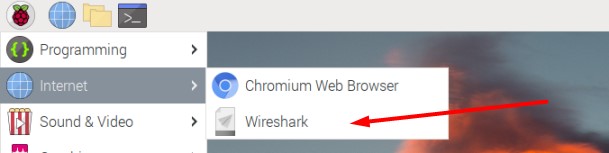
If you prefer using the command line to install new applications, you can do the same thing by opening the terminal, and typing those commands:sudo apt update
sudo apt install wireshark
Are you a bit lost in the Linux command line? Check this article first for the most important commands to remember and a free downloadable cheat sheet so you can have the commands at your fingertips.
And if you are using Ubuntu and want to install Wireshark on it, I have a dedicated article on this topic (click on the link).
It's a free PDF guide containing every Raspberry Pi Linux command you should know!
Download now
It's a free PDF guide containing every Raspberry Pi Linux command you should know!
Download now
How To Use Wireshark on Raspberry Pi
Installing Wireshark is pretty straightforward. If you haven’t used this tool, the difficulty is probably starting now to understand exactly what it does and how to use it. Let’s browse the most important features together.
First steps with Wireshark
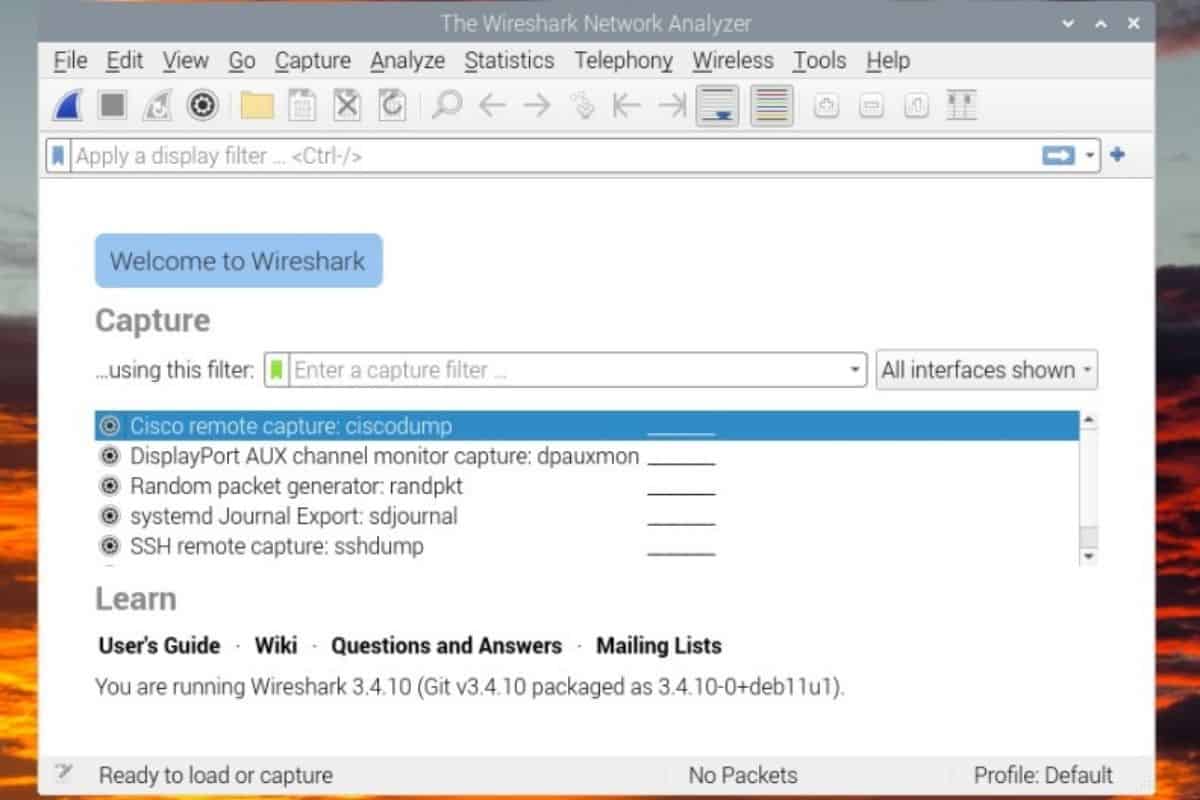
When you start Wireshark for the first time, the interface looks like this:
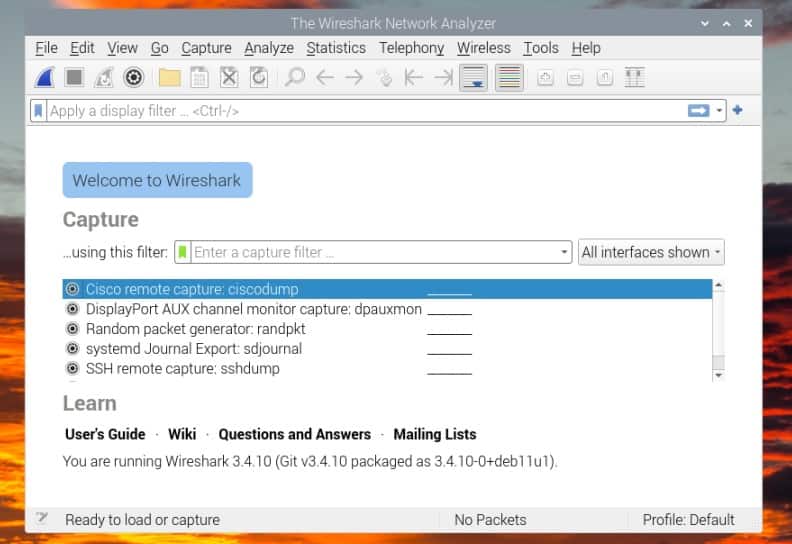
Basically, you can almost do nothing with this tool before having a network capture to analyze. You can either start a new one, or import one from a file, but you need one.
The issue, is that when you start Wireshark directly, it doesn’t detect any network interface (check the “All interfaces show” dropdown, it’s empty). The explanation is simple, you need to have administrator privileges to use this feature.

Join Our Community!
Connect, learn, and grow with other Raspberry Pi enthusiasts. Support RaspberryTips and enjoy an ad-free reading experience. Get exclusive monthly video tutorials and many other benefits.
Learn moreSo, the first thing to do, is to start Wireshark with sudo.
You can either start it from a terminal, by using:sudo wiresharkOr editing the shortcut in the main menu to use sudo by default:
- In the main menu, go to Preferences > Main Menu editor.
- Find the Wireshark item, under Internet.
- Click on “Properties”, and add “sudo” at the beginning of the command field:
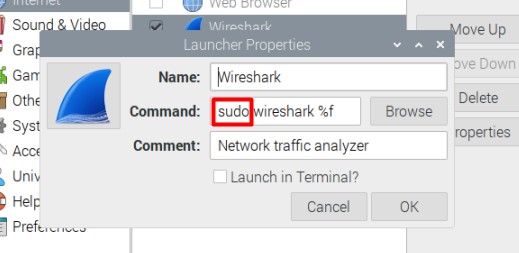
- Once done, click on “OK” to save this change.
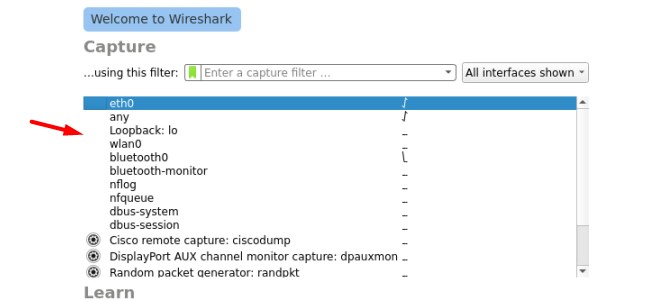
Restart Wireshark from the main menu. You should now have access to all the interfaces:
That’s it, Wireshark is now ready to use. Let’s learn how to do a capture and analyze it.
Capture network traffic
The main feature that you’ll use frequently with Wireshark is the capture. Basically, the idea is to listen what’s happening on one of your network interfaces. If your Raspberry Pi is just one element of your network, it will mostly be your own network usage, and a few talks between your device and the other ones.
But when your Raspberry Pi is an important node of this network (DNS server, gateway, etc.), it will record almost anything happening on the network. This will be pretty useful for the analysis part I’ll introduce later (and it’s also used by hackers and pen-testers).
Anyway, here is how to start a capture with Wireshark:
- Select the interface you want to capture in the list.
In general, it will be “eth0” if your Raspberry Pi is plugged via Ethernet, or “wlan0” if you are using a Wi-Fi connection. - Click on the first icon in the top bar.
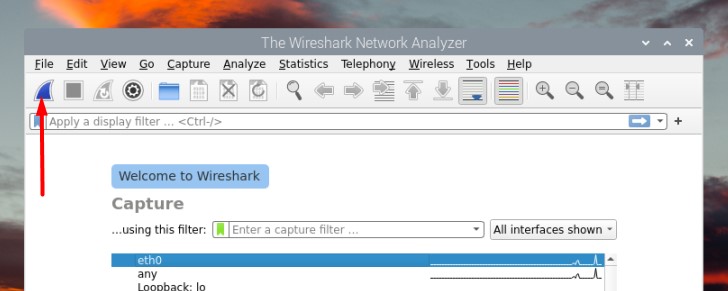
You can also double-click on the interface name on the home page, use the capture menu, or just press CTRL+E. - If everything is working properly, the window will start to be filled with a table refreshing constantly:
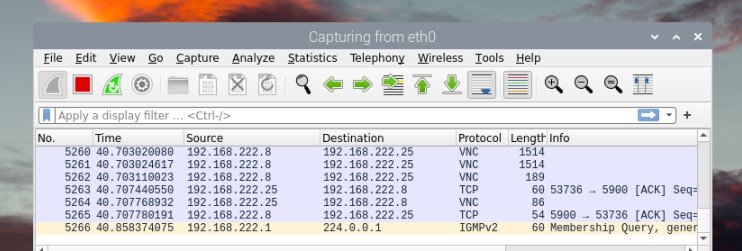
Each line is a packet detected by Wireshark.
Let this run as long as needed. It will keep capturing the network traffic until you press the stop button (the red one in the top bar).
Packets analysis
After doing a capture of the network traffic, you can then analyze its content. The screen is split in three main parts:
It's a free PDF guide containing every Raspberry Pi Linux command you should know!
Download now
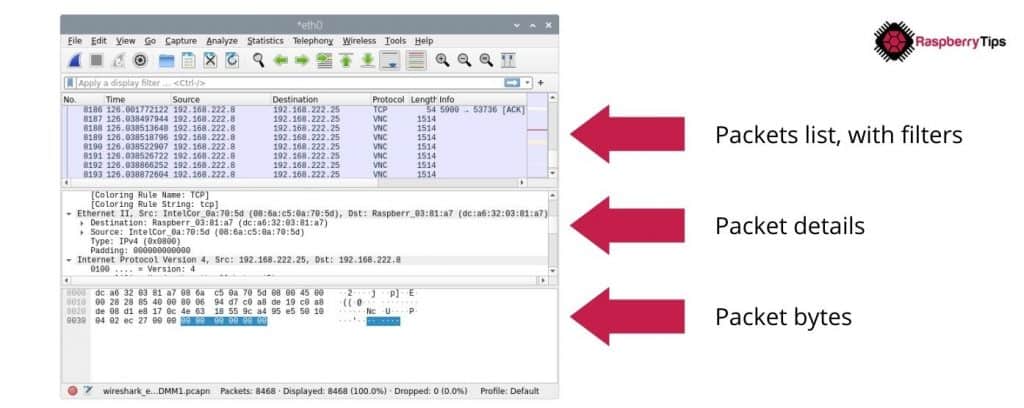
- Packets list: the first part. Where you can see all captured packets, and use the display filters to only show those that interest you. I’ll get back to this later.
- Packet details: when you select one packet, you can see its content, in a more or less readable text format.
- Packet bytes: the exact packet content, with bytes and hexadecimal format (less useful for us ^^).
On the first part, you’ll see the macro information, like source, destination and protocol. It will help you to select the ones you are interested in. For example, if you are looking for suspect HTTP activity from 192.168.222.8, you can skip everything unrelated (like VNC and other IP addresses). I’ll show you how to filter this list in the next section.
Packet analysis with Wireshark could be a dedicated article, or even a full book on its own. So, I won’t give you more details here, but you can check the official documentation to learn more about it.
Filters
But the main issue when you are looking for something specific on Wireshark, is to filter the packets list (the first table). Devices talk quite a lot on our networks, and it might be overwhelming to see all of these packets.
That’s why Wireshark includes a field near the top of the screen, where you can enter a formula to only show the packets that are potentially interesting for you (or exclude them).
Here is a first example:tcp.port == 80It’s exactly what you think, it will display only the packets using the port 80 (HTTP traffic in general).
Reading these filters is quite intuitive, but instead of trying random formulas, here are some of the most useful ones:
- Filter the IP address (to analyze only one device on your network):
ip.addr==192.168.222.8 - You can also filter the source or destination IP addresses with:
ip.src==192.168.222.8
ip.dst==192.168.222.25 - As seen in the previous example, you can filter the ports with:
tcp.port==80
udp.port==5060
Many other filters options are available, but those few should already be pretty useful to filter your list.
Also, you can use different operators and boolean statement to create more complex filters.
Here are a few examples:
| Filter | Description |
|---|---|
| ip.src!=192.168.222.25 | Source IP address is not 192.168.222.25 |
| vnc or http | Only display VNC or HTTP protocols |
| ip.src==192.168.222.8 and ip.dst==192.168.222.1 | Filter traffic between my Raspberry Pi and the gateway |
When you start typing something in the filter field, it will autofill with available options and your filter history. So, even if it seems complicated when you start from scratch, it will become easier and easier overtime. And as for the packet analysis, you can easily find help online for more complex filters.
It's a free PDF guide containing every Raspberry Pi Linux command you should know!
Download now
Want to chat with other Raspberry Pi enthusiasts? Join the community, share your current projects and ask for help directly in the forums.
Wireshark Alternatives In Command Line
If you don’t have a desktop interface on your Raspberry Pi, or want to do some network analysis in a terminal or via SSH, it’s possible. You just have to use other tools, as Wireshark doesn’t offer a command line interface.
Here are two alternatives you can try in this case.
Tcpdump
Tcpdump is a command-line tool you can use to capture network traffic.
You can install it with APT, it’s available in the default repository on Raspberry Pi OS and most distributions:sudo apt install tcpdump
Using the main command will just show all the packets on your screen:sudo tcpdump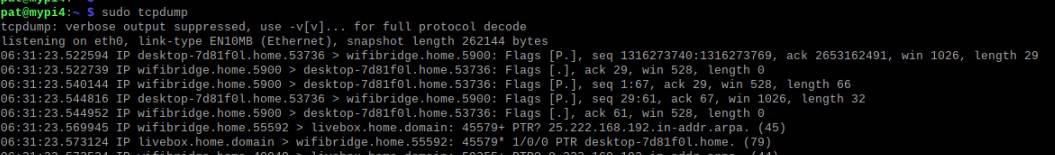
This is not really useful.
But you can add several options to your command, to only show what you want, and store the result in a capture file, for example:sudo tcpdump -i eth0 -w tcpdump.cap
You’ll then record only the traffic on the Ethernet network card, and save the results in a file (tcpdump.cap). Use CTRL+C to stop the capture.
What’s great is that you can then open this file with Wireshark (File > Open), and use all the nice features we have seen previously.
I’ll generally have Wireshark on my computer, do captures on my servers with tcpdump and then open the file on the computer to analyze it.
To see all the options for tcpdump, either use:sudo tcpdump --helporman tcpdump
Tshark
Tshark is an alternative to Wireshark, to be used in the terminal directly. It’s created by the same developers as Wireshark, so you’ll find many similarities.
It’s also available in the default repository on most distributions, so you can install it with:sudo apt install tshark
And then use a similar command to create a capture. But you need to create the destination file first, and add some permissions (I don’t know exactly why you need this with sudo, but it doesn’t work without it).touch tshark.cap
chmod o+w tshark.cap
sudo tshark -i eth0 -w tshark.cap
Like with tcpdump, you can press CTRL+C to stop the capture, and import the file in Wireshark to analyze it. But tshark also has a ton of options you can use, to do the same things as in Wireshark with the command line (for example, -f allow you to use capture filters, and -Y to use display filters).
I hope this article was helpful, feel free to add any information or ask any question in the community, I would love to have your thoughts about this.
Whenever you’re ready, here are other ways I can help you:
The RaspberryTips Community: If you want to hang out with me and other Raspberry Pi fans, you can join the community. I share exclusive tutorials and behind-the-scenes content there. Premium members can also visit the website without ads.
Master your Raspberry Pi in 30 days: If you are looking for the best tips to become an expert on Raspberry Pi, this book is for you. Learn useful Linux skills and practice multiple projects with step-by-step guides.
The Raspberry Pi Bootcamp: Understand everything about the Raspberry Pi, stop searching for help all the time, and finally enjoy completing your projects.
Master Python on Raspberry Pi: Create, understand, and improve any Python script for your Raspberry Pi. Learn the essentials step-by-step without losing time understanding useless concepts.
You can also find all my recommendations for tools and hardware on this page.